

Dubai real estate transactions totalled AED 574.12 billion, about USD 156 billion, across 165,018 deals between January and September 2026. The figures are based on Dubai Land Department (DLD) records, published by Emirates 24/7 on 1 October 2026.
Property sales alone reached about AED 379.4 billion, according to the breakdown published by Emarat Al Youm, the Arabic-language paper from the same media group. That is the second-highest nine-month sales value in the market's history, behind only 2025.
Dubai Real Estate Transactions: The Nine-Month Figures
The AED 574.12 billion total covers three types of registered transaction: sales, mortgages and gifts. Of these, sales are the figure that reflects buying activity. All figures in this section and the September section come from Emarat Al Youm's report of 1 October 2026, based on DLD data.
| Transaction type | Value (AED billion) | Number of deals |
|---|---|---|
| Sales | 379.4 | 123,416 |
| Mortgages | 151.13 | 34,910 |
| Gifts | 43.6 | 6,692 |
| Total | 574.12 | 165,018 |
Sales included 104,198 residential units, 9,514 buildings and 9,704 plots of land.
Ready properties led by sales value, with AED 196.08 billion across about 39,320 deals. Off-plan led by number of deals, with 84,090 transactions worth AED 183.32 billion. By our calculation, off-plan accounted for about 68% of sales deals but about 48% of their value.
Part of the gap comes from how the data is classified: all 9,704 land sales are counted under ready properties.
September 2026 on Its Own
September transactions totalled AED 50.78 billion across about 16,490 deals. Sales made up AED 29.66 billion, across about 11,430 deals.
The split was similar to the year to date. Ready sales came to AED 16.03 billion across 3,955 deals, while off-plan sales came to AED 13.63 billion across 7,476 deals. Mortgages added AED 16.79 billion across 4,266 deals, and gifts added AED 4.33 billion across 796 deals.
Where Were Sales Concentrated?
Business Bay led by sales value in the first nine months, with more than AED 20 billion. These were the top 10 areas by sales, according to Emarat Al Youm:
| Rank | Area name in DLD records | Sales value (AED billion) |
|---|---|---|
| 1 | Business Bay | More than 20 |
| 2 | Airport City | 17.72 |
| 3 | Al Yalayis 1 | 16.09 |
| 4 | Palm Deira | 12.98 |
| 5 | Palm Jumeirah | 11.61 |
| 6 | Me'aisem 2 | 11.5 |
| 7 | Jumeirah Village Circle | 10.29 |
| 8 | Palm Jebel Ali | 9.4 |
| 9 | Burj Khalifa | 8.86 |
| 10 | Sheikh Mohammed bin Rashid Gardens | 8.5 |
These are the area names in DLD records, which do not always match the names used in marketing. Palm Deira is the registered name of Dubai Islands, and the Burj Khalifa area includes Downtown Dubai.
The list mixes established areas, such as Business Bay, Palm Jumeirah and Jumeirah Village Circle, with newer master-planned areas such as Palm Jebel Ali.
What Does It Mean for Israeli Investors?
The headline total is impressive, but the detail gives a more useful picture. The points below are our analysis of the published data, not DLD statements.
The Market Is Active, but Behind 2025
Including mortgages and gifts, W Capital's analysis of DLD data puts total transactions for the same period of 2025 at AED 668 billion, against about AED 574 billion this year. By our calculation, that is a fall of about 14%.
The same analysis put sales for the same period of 2025 at AED 495.8 billion, against about AED 380 billion this year. By our calculation, that is a fall of about 23%. Both statements are true: this is the second-highest figure ever, and it is lower than last year's. The slowdown sharpened in the third quarter: W Capital put Q3 sales at about AED 92.3 billion, against AED 169 billion in Q3 2025, a fall of about 45% by our calculation.
Off-Plan Leads on Deal Count, Not Value
About two in three sales were off-plan. For a buyer weighing both options, that means a wide choice of new projects, alongside a ready market that still accounts for more of the value. Our guide, "Is it worth buying off-plan in Dubai in 2026?", looks at this in depth.
Mortgages Are a Significant Part of the Market
Mortgage registrations reached AED 151.13 billion, about 26% of total transaction value. For buyers from Israel, non-resident financing works on different terms, so it is worth checking early.
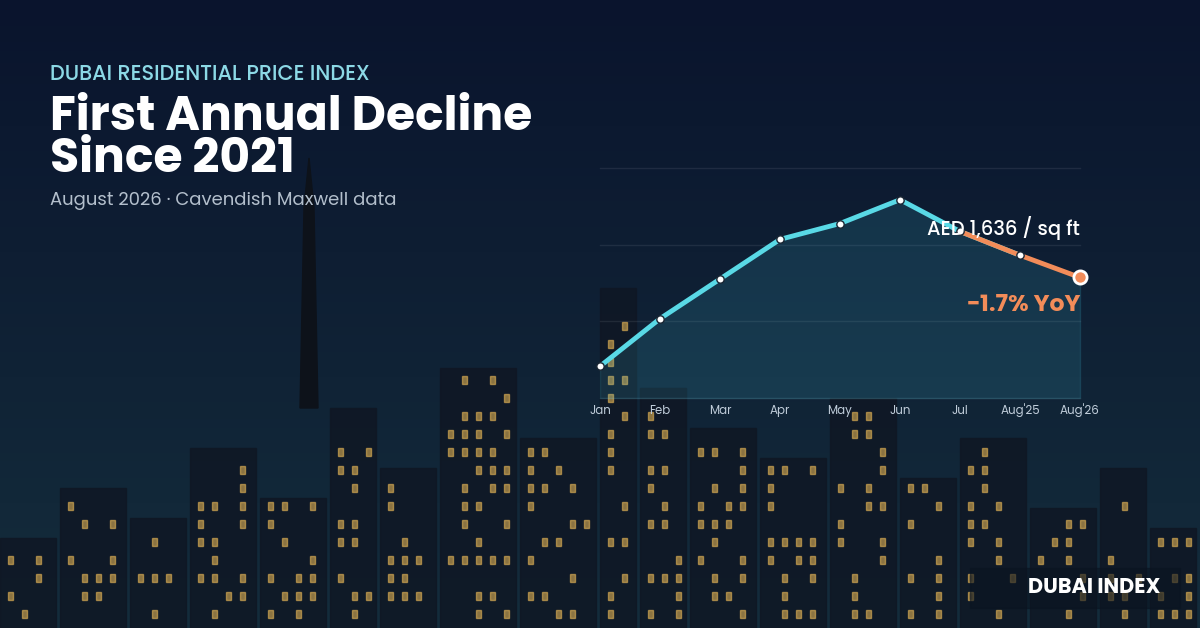
Transaction Value Is Not a Price Index
The data shows how much was registered and where. It does not show whether prices per sq ft rose or fell, and says nothing about rental yields. A busy area is not necessarily the right one for a given goal or budget.
How to Use the Data for Your Purchase
The nine-month figures show clearly where activity is concentrated, but less clearly what suits a particular buyer. The next step is to compare the areas on the list against your budget, time horizon and goal. Dubai Index's area pages are a good place to start.
Not Sure Which of Dubai's Busiest Areas Fits Your Budget?
Book a free consultation with a Dubai Index specialist to review the data for the areas you are considering, or send us a message on WhatsApp.
Figures marked as our calculations are derived from the published data. The year-on-year falls of about 14%, 23% and 45% were calculated from W Capital's figures.
This article is for information only and is not legal or investment advice.